Gold and stock correlation, how has it changed in 10 years?
Last Update: 27/12/2024
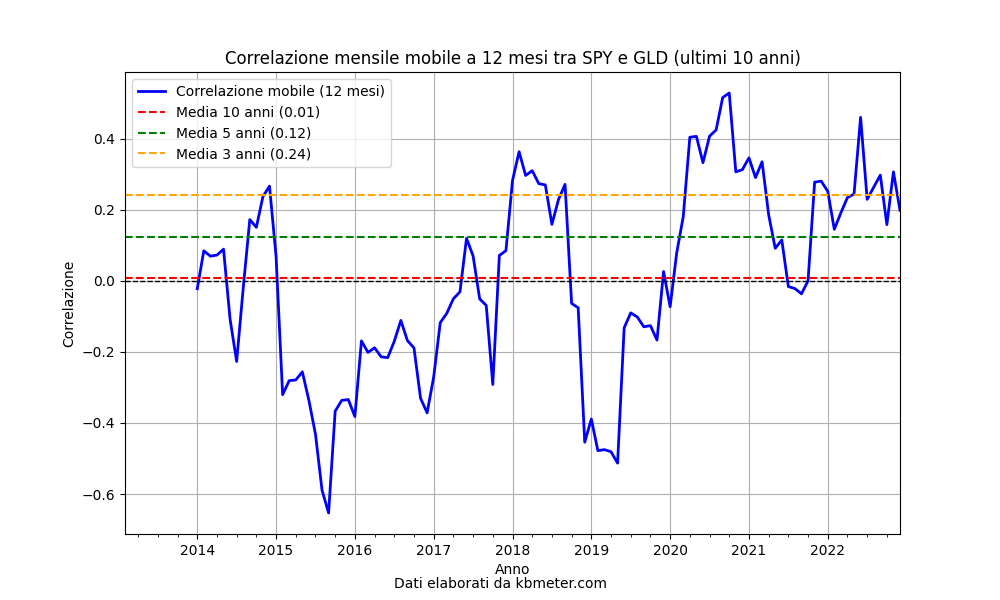
In the chart below we see the correlation between the S&P500 and bullion over the past 10 years. We first observe the prevalence of positive correlation from 2020 onward, but at the same time we note that the value of this correlation always remains below the 0.5 threshold.
Recall that positive correlation means price movement in the same direction. The closer to 1, the stronger the correlation. Vice versa for values below zero.
In recent months, gold prices are hitting new records. Always considered a safe haven asset in times of uncertainty as stocks falter, gold has been showing a positive correlation with the stock market in recent months.

Other interesting information concerns the average correlations (the horizontal lines in the graph). The 10-year one is at 0.001, meaning essentially no correlation between the two assets. The 3-year one reaches 0.24, signifying a weak positive correlation. In all three time horizons we see no negative average correlation.
Gold therefore does not seem to be able to hedge against equities, that is, it does not systematically have positive returns as much as equities have negative returns. However, it remains an excellent portfolio diversifier as it has little or no correlation with equity performance.
